


Home Assistant is a great open source home automation platform. With so many integrations with the "internet of things" or IOT devices, a lot of information passes through Home Assistant.
Out-of-the-box Home Assistant has a recorder and history component. These are great tools to see what the state of something was at a certain point in time, or what time an automation executed. This is a basic way to look at the data captured by Home Assistant.
However there are some pretty big limitations. Because of the amount of data Home Assistant is collecting, storing that data can become quite cumbersome. It won't take you long before your Home Assistant database sizes are in gigabytes, and your home automation starts to slow down because of it.
Thankfully Home Assistant has some integrations we can use. In my setup, I use the recorder and history components to track the last two days of history from Home Assistant. This ensures Home Assistant has a lean database, and I can debug something that went wrong by looking in the recorder.
Why You Should Be Recording Data
The more information your smart home has, the smarter it can be. We tend to think of this data as sensor readings. "What is the temperature in the room right now?" would be a classic question answered by sensor data.
However long-term trends and data can also be important. Let's take a look at some questions you might be able to answer by analyzing your sensor data over longer periods.
- How much light does the living room get in winter months, compared to summer months?
- What's the average temperature inside during the summer months, compared to winter? Are we cooling/warming the house too much?
To answer these types of questions, we need to use a separate system. Home Assistant comes with a few options, but today we're going to setup Grafana, which is a free and open source graphing dashboard that looks beautiful.
The Database
There are two parts to this setup. First, is the database. By default Home Assistant will store its history in an SQLite database in your configuration directory. These files can get pretty big over time, so we'll want to keep our long-term data somewhere else.
There's a few options for this, but one with great support in Home Assistant is InfluxDB.
The Interface
The second part is the interface. Which is Grafana. There's a few ways to install Grafana, but because I'm using Home Assistant on my Synology NAS, I'm going to use Docker.
I looked around, but ended up creating my own Docker image based on this awesome Docker setup by Samuele Bistoletti, Sams's does everything I need, but it comes installed with StatsD/Telegraf, and uses MySQL. As I want to be able to store the data from InfluxDB and Grafana, I created my own Docker image which allows that. This way if you decide to upgrade to a newer version of InfluxDB/Grafana in the future, you'll have the data available on your host machine, and it won't get destroyed if you remove the Docker container from your system.
docker run -d \ --name docker-influxdb-grafana \ -p 3003:3003 \ -p 3004:8083 \ -p 8086:8086 \ -p 22022:22 \ -v /path/for/influxdb:/var/lib/influxdb \ -v /path/for/grafana:/var/lib/grafana \ philhawthorne/docker-influxdb-grafana:latestThere's more details about this container and how you can use it on the GitHub Repository.

Together with Rohan Karamandi, hear me break down the latest Home Assistant release and talk with other users of Home Assistant across the open-source community.
Configuring InfluxDB & Home Assistant
So at this point I'm expecting you've got InfluxDB and Grafana installed and up-and-running. Oh, one of the great things about using InfluxDB is that you could have it running on a separate machine. So, if you're using Home Assistant on a Raspberry Pi, you could have InfluxDB running on a PC or NAS that's always on. That way your historical data doesn't take up space on your SD card.
We'll first need to setup a database in InfluxDB. Navigate to your InfluxDB installation. If you followed my Docker instructions, you'll find it running on port 3004, otherwise it uses port 8086 for non-docker installations.
We'll be presented with the InfluxDB Web Interface. We're going to run a query to create a new database just for Home Assistant.
CREATE DATABASE home_assistant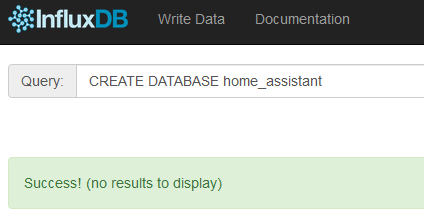
Once you've run that query, a new database will have been created for Home Assistant to use. Because we're not going to expose InfluxDB to the open internet, I'm not going to bother configuring a username and password to access this table. If you feel more comfortable doing that, check the InfluxDB documentation on how to add users to InfluxDB. Just remember that you'll need to give your user read/write access for Home Assistant to write data into InfluxDB.
Our next step is to configure Home Assistant to start logging changes to InfluxDB. To do this, we'll add the following to our configuration file. Remember to add your username and password if you set one up.
influxdb:
  host: 127.0.0.1
You can change the IP address to the IP address where your InfluxDB install is running if needed. I'm using localhost because my Home Assistant Docker container is running on the same machine.
By default this is going to send everything to InfluxDB. If there's anything you don't want recorded in there, you can use the exclude parameter. There's more information on the options in the Home Assistant component page.
Once you've added this to your configuration, be sure to restart Home Assistant. Watch your Home Assistant log files for any errors to make sure the connection to InfluxDB is working as expected.
Getting to know Grafana
Before we start setting up Grafana, let's first learn a bit about it.
Grafana allows you to setup Dashboards with graphs and widgets. The dashboards can be configured with multiple types of graphs out-of-the-box. You can easily change what time period is displayed on the screen from the top-right menu. You can also configure it to refresh automatically. Great for a wall mounted display that needs to display realtime stats, like temperatures etc.
You'll be able to setup multiple dashboards, and even multiple users. You could for example, have a user account for downstairs, and one for upstairs. You can then login to Grafana on the downstairs tablet, knowing someone won't be able to access the upstairs dashboard without the correct username and password.
Another great feature of Grafana are Alerts. You could have Grafana send you alerts if the temperature inside reaches a certain threshold. This is a great way to keep your Home Assistant automations clean and tidy, by letting a reporting system take care of alerting you to a less critical problem.
Setting Up Grafana
Now it's time for the main event. Now that we've got data being recorded into the InfluxDB database, we want to use Grafana to make some nice charts of it all.
The first thing you'll need to do is setup a username and password. This first username and password will be the 'root' user, which will have complete access to Grafana. We'll use this account to setup the dashboards. I'm going to skip over creating multiple users. If someone has access to all my Grafana dashboards, there's probably bigger problems to solve first.
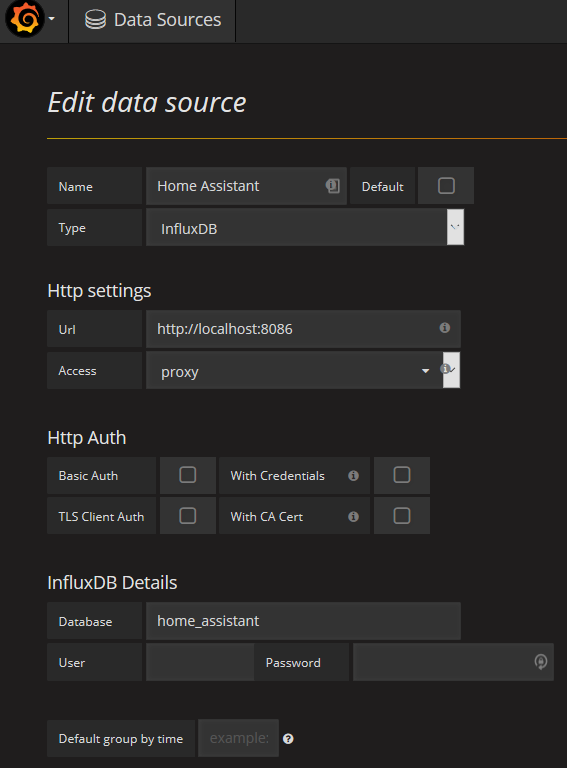
We'll also need to configure our data source, which is going to be InfluxDB. This is us setting up Grafana so it knows where to pull our stats from. Click the Grafana icon at the top left hand side of the page, and then click Data Sources.
You'll then need to setup how Grafana will communicate with InfluxDB. If you're using my Docker container, here's how I've set it up.
Creating the first Chart
Once you've setup your data source, we can start off by creating a simple temperature line chart. This chart will display the outside temperature, we'll also include an area which will display the current temperature, and the highest and lowest temperatures for the time period specified.
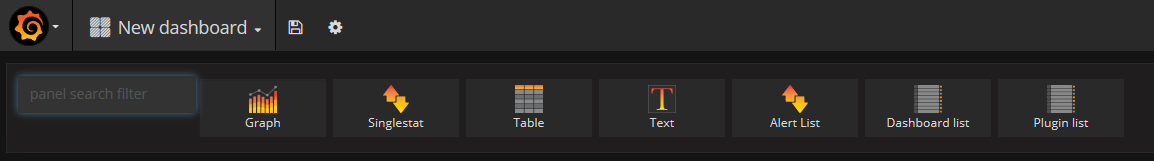
At the top of the page are some icons for types of things you can add to your dashboard. Simply drag-and-drop an icon onto your dashboard. Let's drag-and-drop a new Graph.
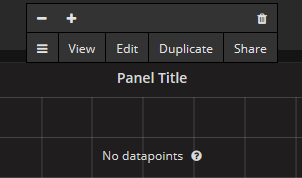
You'll be presented with a blank graph now. Let's click Panel Title to bring up the context menu to edit the graph.
Click the Edit button to open the graph editor at the bottom of the screen.
Here we can see how the graph is defined. Expand the "A" query to see how it is built. This is where we'll make some adjustments to how the graph is reading the data from InfluxDB.
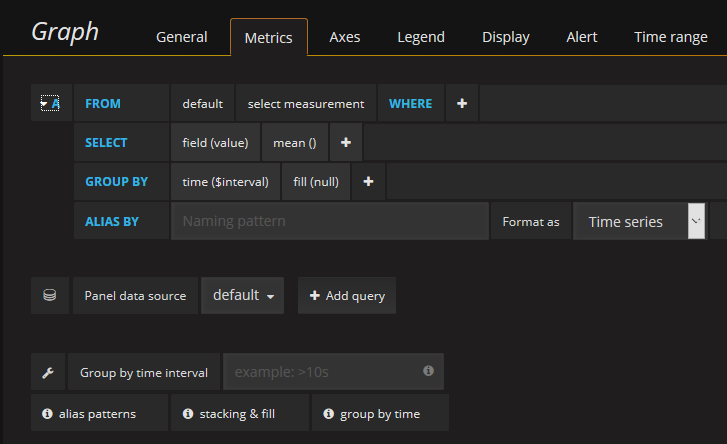
Now we're going to make the following adjustments to the graph:
- Where it says select measurement, we're going to click it and then type in C to select Degrees Celsius, or F to select Degrees Fahrenheit (if you're that way inclined). This will change the graph to only display temperature data collected from every sensor in Home Assistant.
- Next to the WHERE, click the + button and select entity_id. We're going to restrict the data displayed to only show the entity_id of the outside temperature.
- Where it now says select tag value search for your outside temperature's entity_id. I am using the Dark Sky Weather component, so my entity ID that I want is dark_sky_temperature.
- In the GROUP BY we want to change the $interval. Grouping is used where there may not be enough data over certain periods. Let's change it to group by 5 minutes.
- In the ALIAS BY name it something like Outside Temperature. This will give the data a name so we know what we're looking at
Now you should have data on your graph, but something looks wrong? The lines don't seem to match up. This is because we may not have any data points for the period. Maybe Home Assistant only reads the temperature outside once an hour from Dark Sky. We could adjust our GROUP BY interval higher, to something like an hour which might solve that. However if there's ever a time when we get multiple reports per hour, the graph would only display one value per hour.
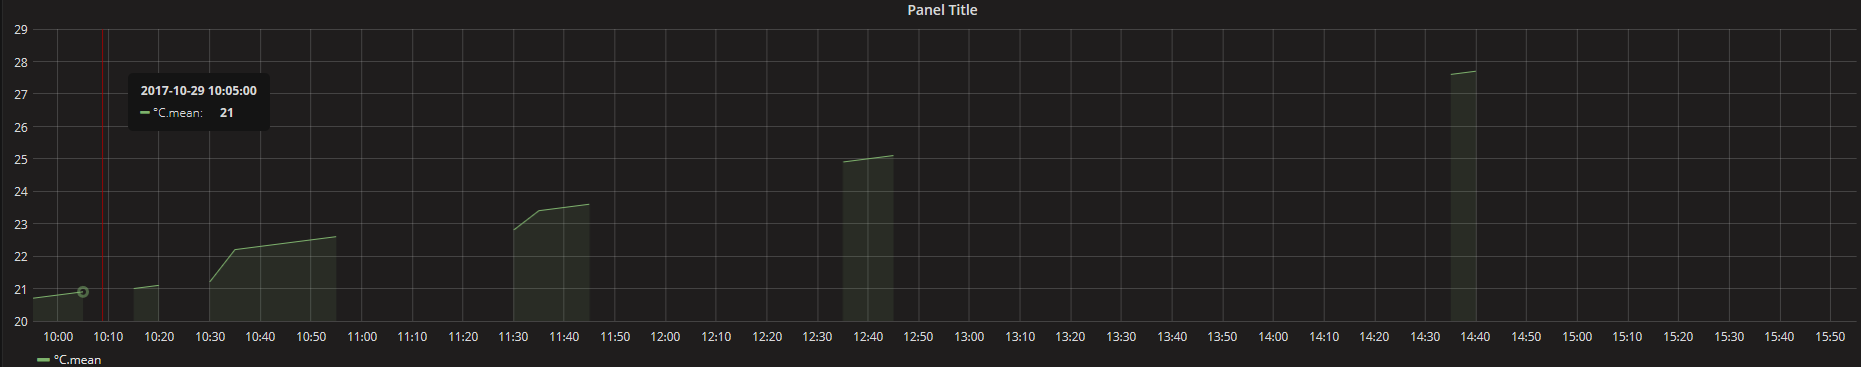
Let's instead tell Grafana to join the lines together based on the previous reading.
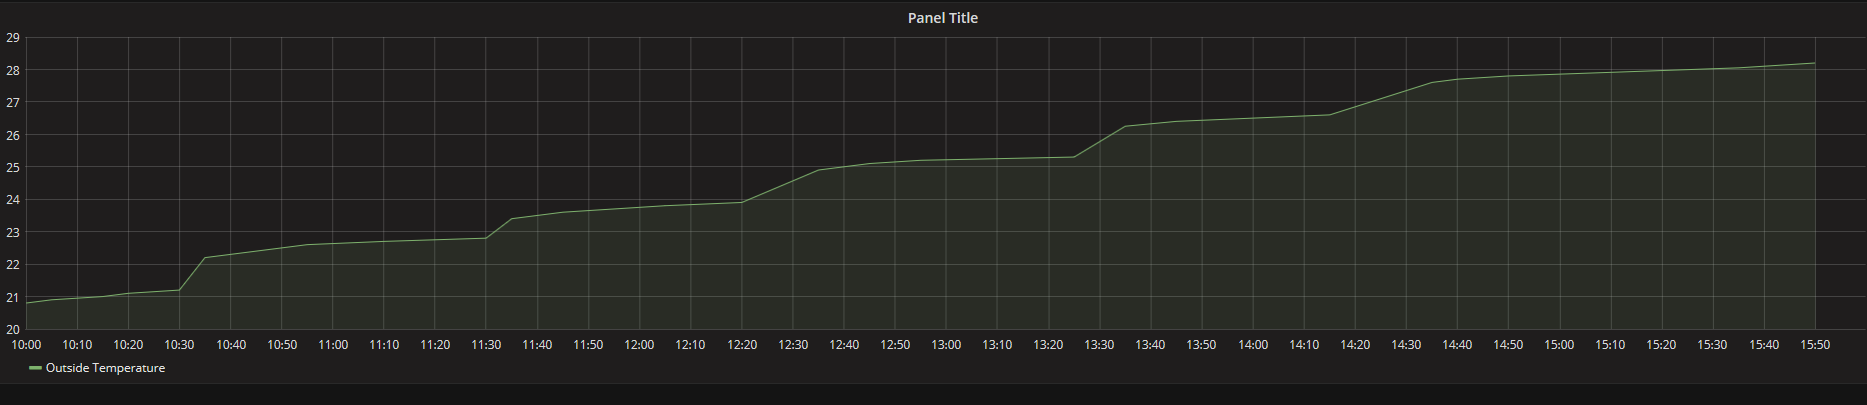
From the Display tab, on the right-hand-side under Stacking & Null value, select Connected for Null value. As soon as you do this, your graph should look much better.
Adding Some Information
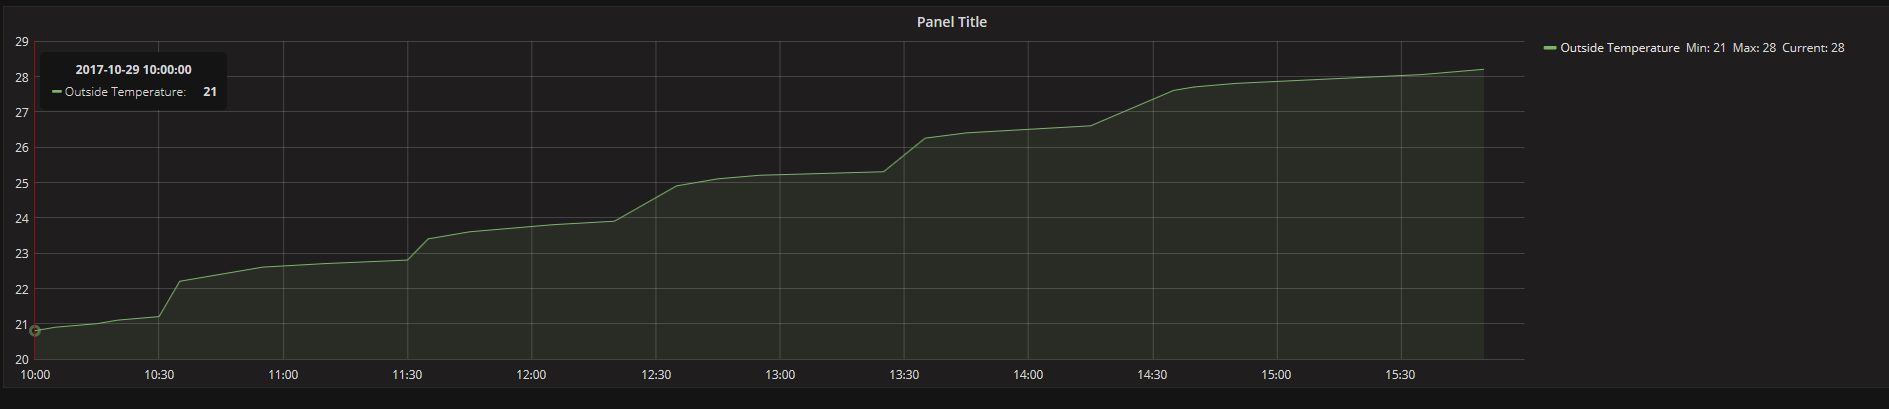
Looking at the graph is cool, but it doesn't make it easy to see what the temperature outside is right now, or what was the lowest/highest temperature for the period.
Go to the Legend tab then let's select Min, Max and Current to be shown. This will add the values below the graph. Under Options select To the right to move the table inline with the graph. We'll set the minimum width for the legend to 350. You should now have something like this:
Adding More Data
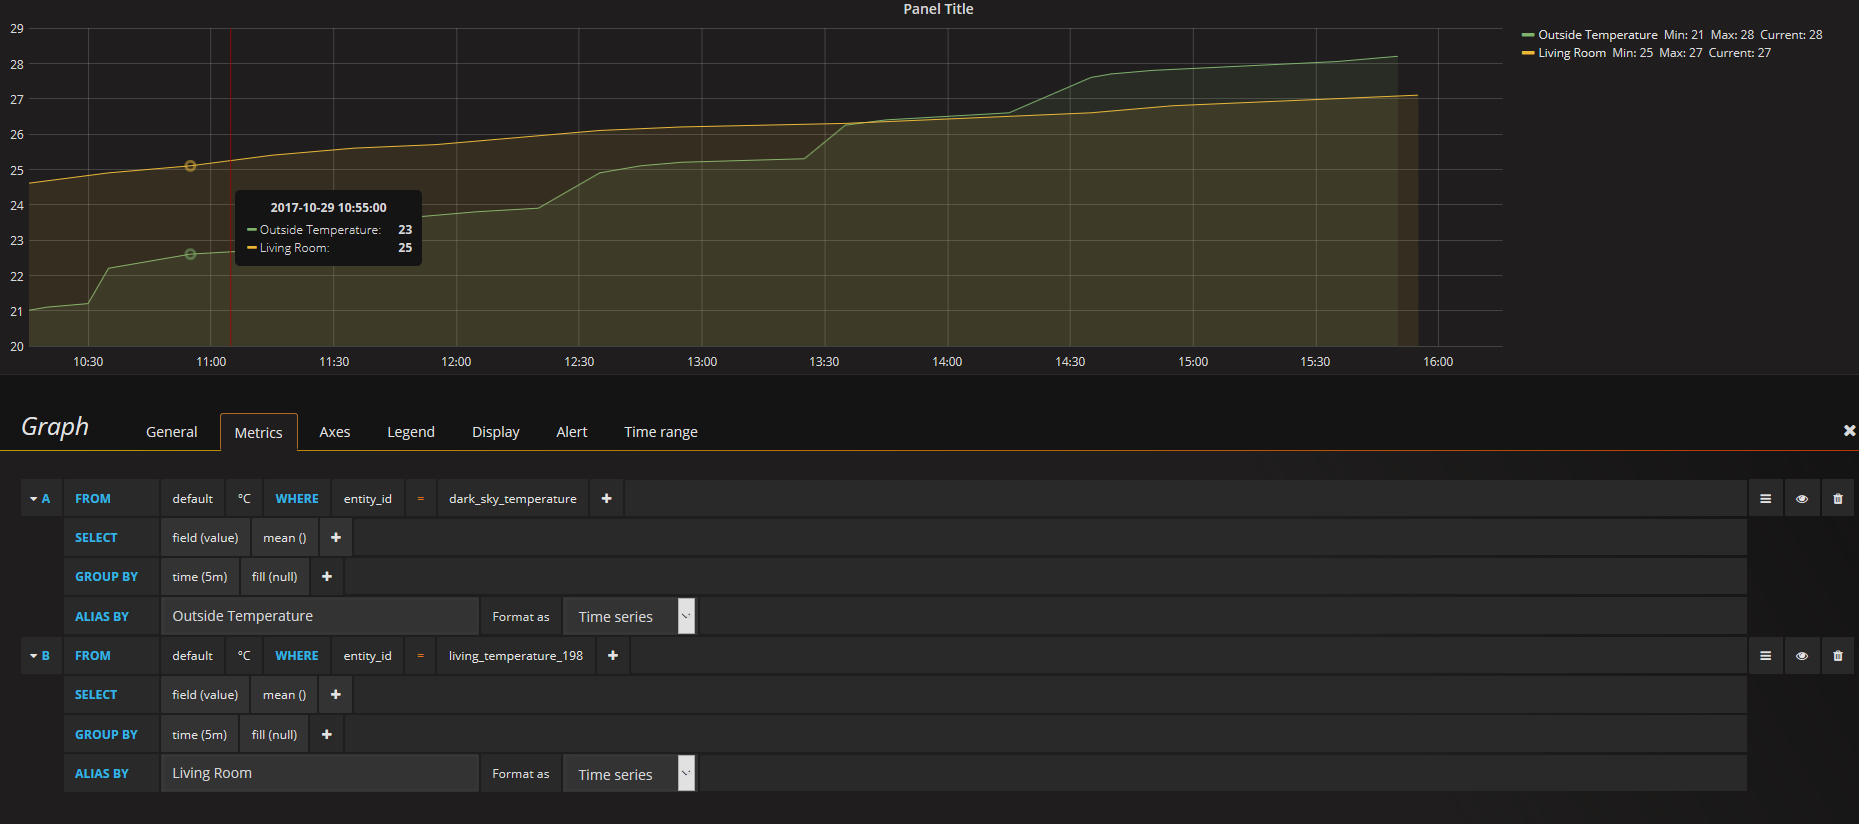
Now that looks pretty good so far. However we have a whole bunch of temperature sensors inside which we could add in. Go back to the Metrics tab, and click the Add Query button. This will create a new query under "B".
We have two options now. We could choose to display each rooms temperature sensor individually. Or we could choose just to aggregate all the sensors into one, and just display the Outside vs Inside temperature on this graph.
I'm going to show you how to do both.
First, let's start off by adding the living room to this graph. We'll follow the exact steps as above for the outside temperature, but this time selecting the entity ID for the temperature of the living room sensor. In my case this is living_temperature_198 which comes from my Vera Lite. This adds a yellow line, and the entire graph now has the living room temperature compared to the outside temperature.
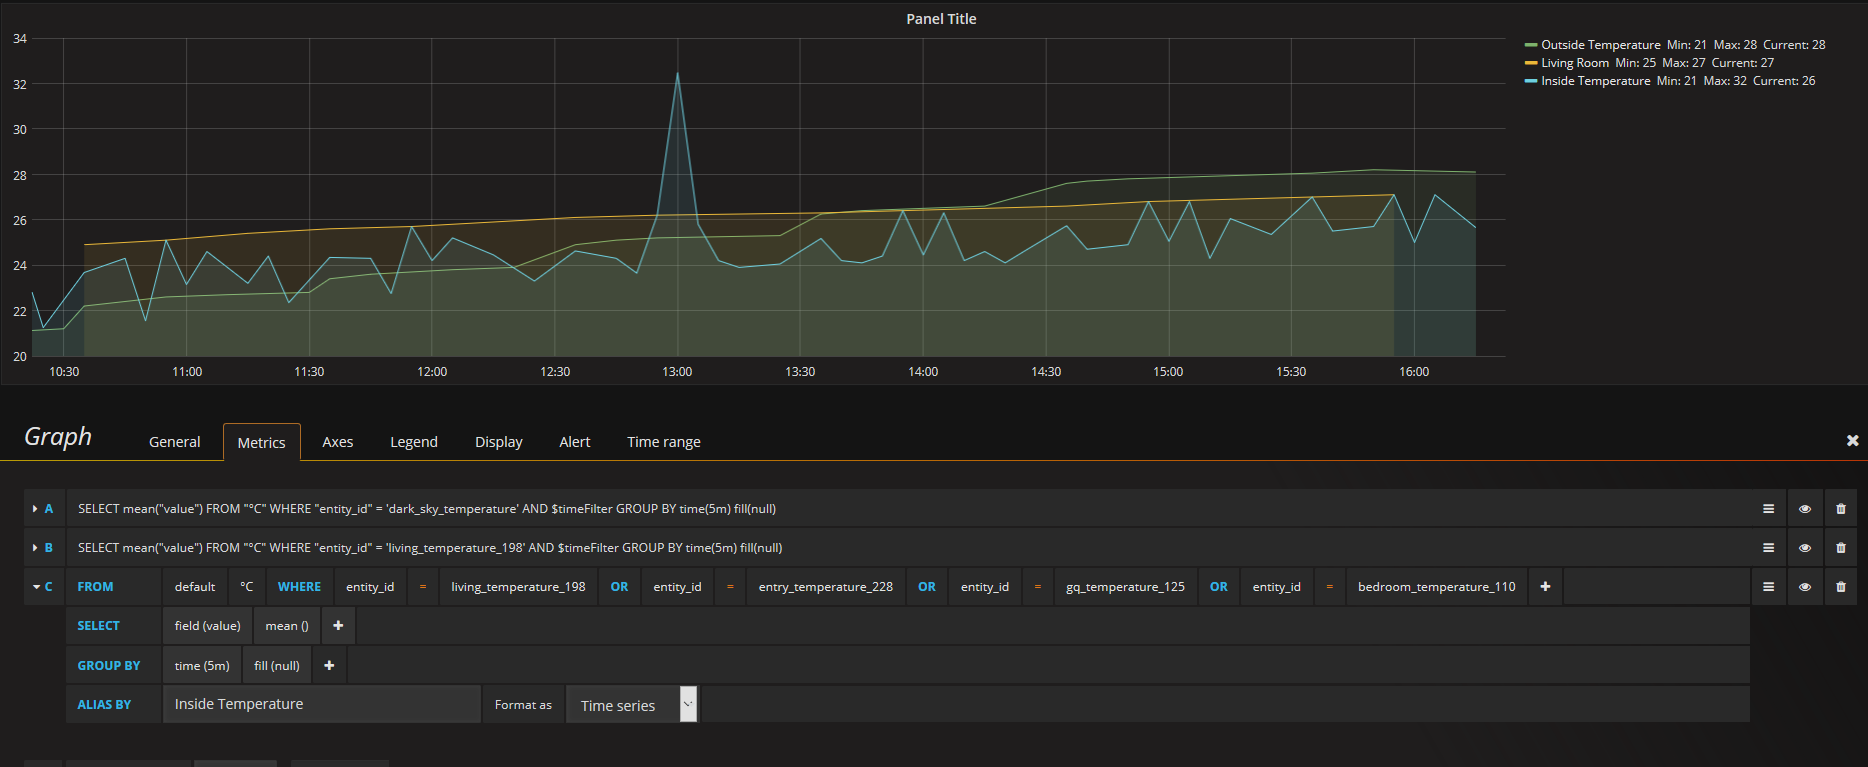
Now let's press the Add Query button again, and add all our internal sensors together.
Let's start by doing the exact same setup as Query B, by selecting the Living room entity ID again. Now we need to add another sensor to this query. Press the + button next to the entity_id to add to the query. You'll see a blue AND appear. Click the AND to change it to an OR. Then, click select tag value to choose an entity_id of another temperature sensor.
Now let's make some final cosmetic changes. Under the General tab, let's change the Panel Title to Temperatures. Then in the Axes tab, let's change the Left Y axes unit from short to Celsius/Farenheit.
Rinse and repeat for other graphs you might want to create as well, like Lux/Brightness, download speeds, etc.
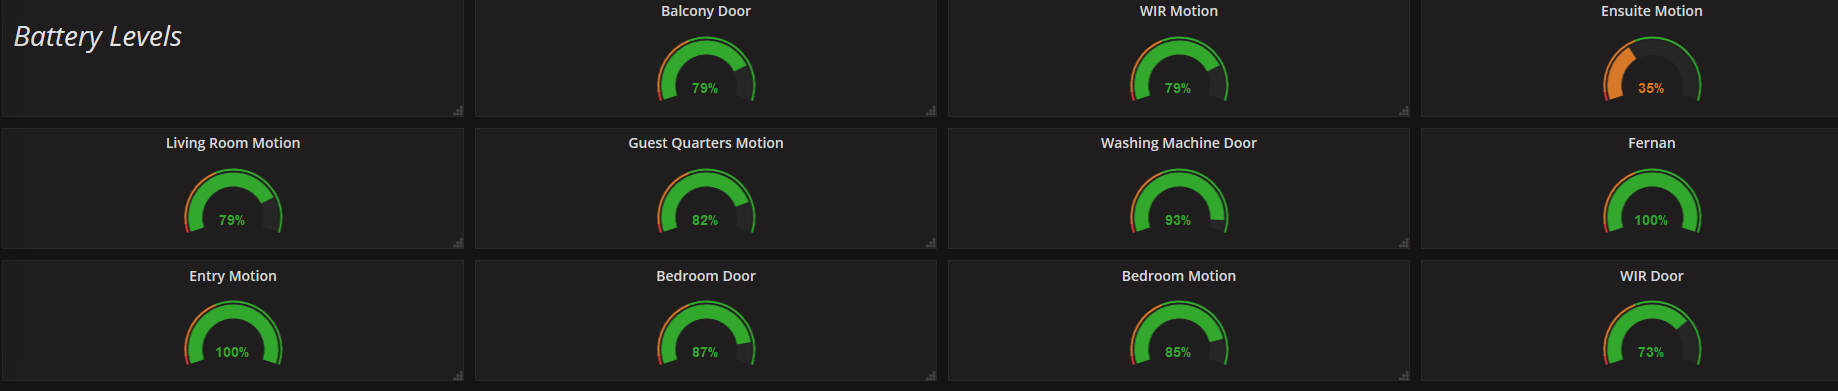
Recording Battery Levels
Another option to display data is Singlestat. I find these great to show gauges of battery levels in devices.
Here's where it can get a bit tricky. Some devices in Home Assistant will add another sensor to report the battery level. Others however will report the battery level as an attribute to the entity_id, which makes it hard to read in Grafana/InfluxDB.
As a habit, I've always created template sensors to extract the battery levels so I can display them in Home Assistant. This makes it easy to read the battery levels into Grafana.
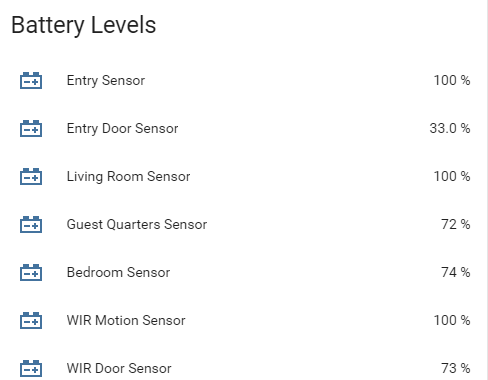
As a sample of how to do this in Home Assistant, here's some code I use to display the battery level for the entry sensor above.
sensor: - platform: template sensors: battery_entry_sensor: value_template: '{% if states.binary_sensor.entry_motion_227 is not none %} {{ states.binary_sensor.entry_motion_227.attributes.battery_level }} {% else %} n/a {% endif %}' unit_of_measurement: '%' friendly_name: 'Entry Sensor'sensor.battery_entry_sensor: icon: mdi:car-battery
Once I have these in Home Assistant, it's easy to get the value into Grafana and InfluxDB.
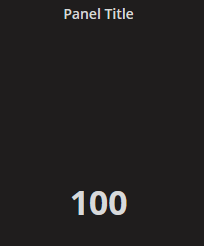
Adding a Singlestat
Now we've got an easy way to get battery levels into InfluxDB and Grafana, let's set up a gauge to display the battery percentage of a door sensor.
Go ahead and drag a Singlestat onto your dashboard. If you can't see the menu where to add it from, on the left-hand-side near each row are three vertical ellipsis. Click those to bring up a context menu for the row, and click Add Panel.
Once again click the Panel Title and then Edit. Expand Query A to change the query that is building the data.
Click the select measurement and this time choose %. In the WHERE we want to choose entity_id and select the battery sensor. For my entry sensor above, I'm going to choose battery_entry_sensor. My sensor doesn't report that often, so I'll select 1 hour as the GROUP BY period, or you could set it to auto if you want.
We now have a basic Singlestat added to the dashboard.
Now let's add the fancy gauges. From the Options tab under Gauge select Show. Straight away you'll see the gauge appear.
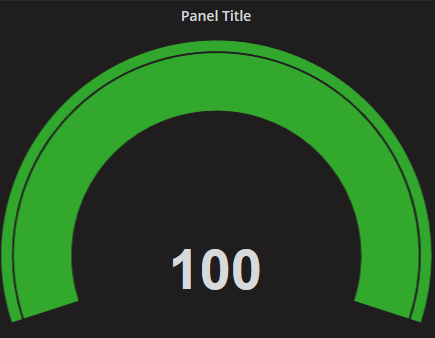
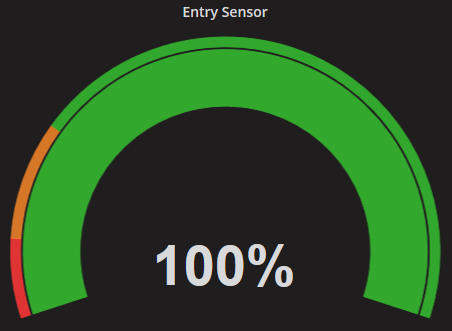
Now let's go to the Coloring column and in the Thresholds type in 10,25. This will make any value below 10% come up as red, and any value below 25 as orange. Anything else will be green, and you can customise the colours if you wish. Finally under the Value column, set the Postfix to % and the Unit to Percent (0-100). Back in the General tab we can give then panel a title, which I'll name as Entry Sensor. Now we should have something that looks better.
Adding Attributes to a Graph
I mentioned that I create template sensors for extracting the battery levels for my devices. Although this works for me, it might not work for you, or there might be other attribute data you might want to track. Power levels reported by my Aeotec Smart Switch 6 units are recorded in attributes for example.
There are ways we can get this into Grafana, as it is stored in InfluxDB.
When creating a new query, instead of choosing the unit of measurement first, like % or KB/s, select the entity_id you would like to get the attribute for. In my entry sensor example above, I would choose binary_sensor.entry_motion_227. Once selected, change the SELECT field(value) so it reads field(battery_level).
Just remember that you'll only be able to report on values with numbers. So states like Home vs Not Home might get a bit tricky.
Ideas for Use
So now we have the basic understanding of how to create a dashboard in Grafana (don't forget to hit the save button!!). What can we do with it?
First, there's heaps of types of data we can graph now:
- Battery percentages over time, see how quickly batteries are used across your sensors to identify which ones are depleting the quickest
- Power usage for main appliances like TV's, Fridges, Heaters and Airconditioners
- Moisture levels in your indoor plants (I use the MiFlora Flower Sensors for these)
- Download rates for applications like Transmission
- Internet Speed
- TV Volume Level (I can see what volume levels my Sonos Playbar is currently set to)
- Humidity Levels in bathrooms to see what time of day people are showering or who's having extra long showers (Z-wave multisensors are great for this)
Now we can take a look at this data over longer periods, for fun and potentially to save money. You can use the data to refine what the temperatures need to be inside vs outside before the AC comes on for example. Or how often your Rain Bird watering system should water your garden, based on how quickly the moisture in the soil dries out. If you notice that your fridge/freezer has started to use more power than usual, it might need a new seal or something.
There's also some great options to setup alerts. Continuing the fridge/freezer example, if it starts to use more power than usual for the day, send an alert. Someone may have not closed a door properly. Or if your AC usage goes over X amount, send an alert that you're going to have an expensive day, and consider opening a window instead.
Of course these are just some ideas I've had. What are you tracking or hoping to track in your Grafana dashboard?
See the products I use in my smart home